
If you are an avid Hacker News user, you would know that there's a hiring comment thread during the start of every month called, Who is Hiring. Hundreds of companies from across the world post job posts as comments to that thread every month hoping to find potential employees.
Unlike many other readers, HN users tend to be more technology focussed, so I thought analyzing the job posts would give some insight into how 2018 in software recruiting has been.
There's a lot of data, so I decided to focus only on the below parameters.
- Locations with most Jobs
- Remote Work - Number of job posts which allow remote work
- Visa - Number of job posts which sponsor visa
- Roles - Top roles that are being hired
- Skills - Popular required skill set across all job postings.
Data
I have scraped all the 12 months of job posts(comments on who is hiring threads) in 2018 using the firebase API and a golang hacker news wrapper library.
Locations
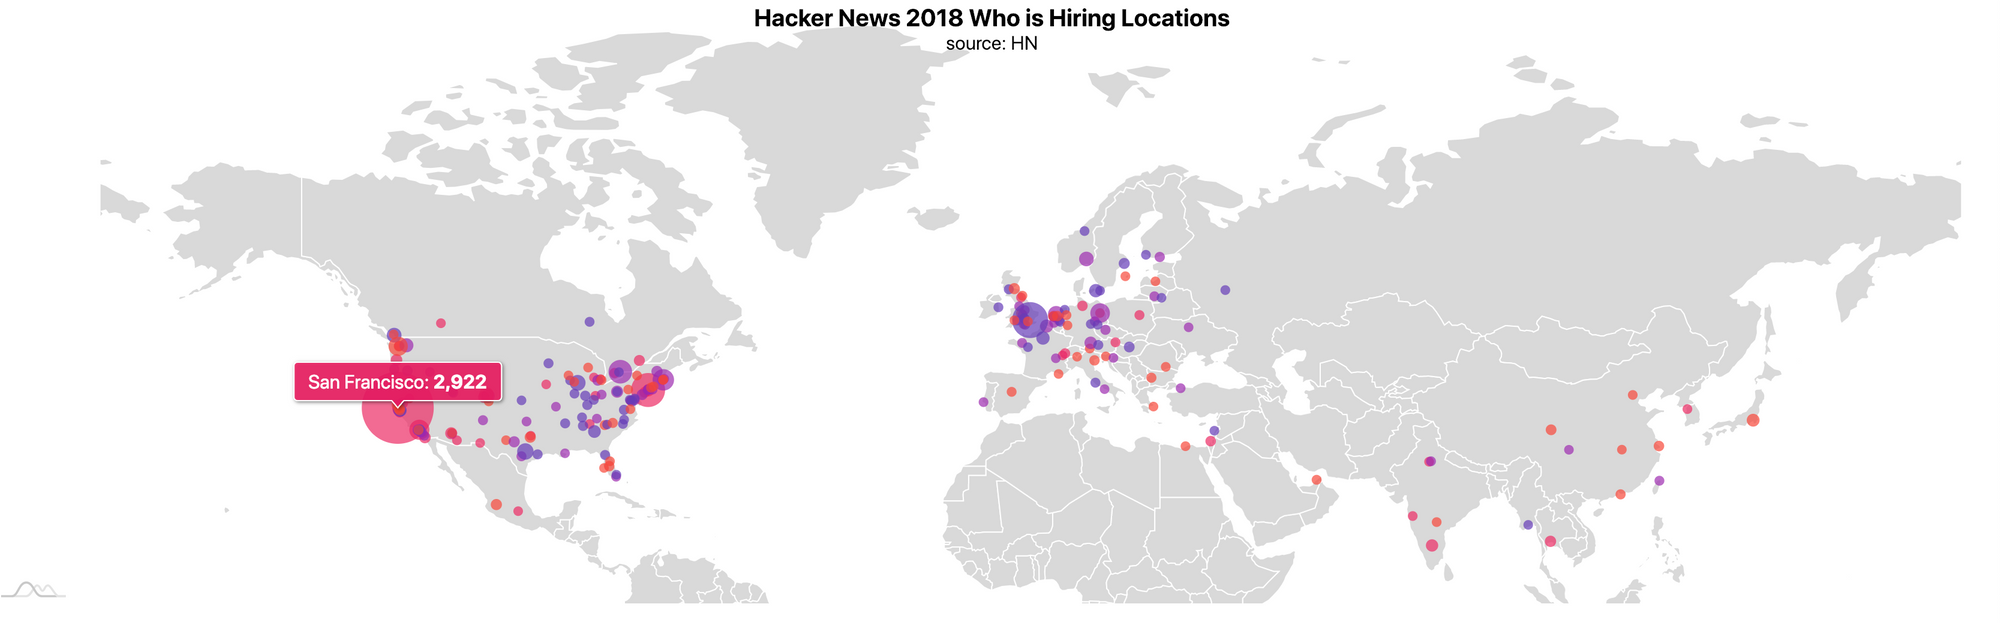
To find out all the locations in a job post, I used geotext , a python module which gives you a list of places from the text. After aggregating results from all 12 months job posts, I used Google Places API to get latitude and longitude for each city and visualized on a map using AmCharts.
In 2o18, the top 10 locations with most jobs are below.
  "San Francisco": 2922
   "New York": 1746
   "London": 1236
   "Toronto": 660
   "Boston": 558
   "Los Angeles": 498
   "Berlin": 474
   "Seattle": 456
   "Austin": 324
   "Amsterdam": 318
Unsurprisingly San Francisco beats most cities by a wide margin and close second is New York. Below are all cities with the number of job posts in that city in 2018 visualized on an interactive map.
Remote Work
One of the evolving phenomena since the last 2-3 years is companies embracing remote work. More companies are offering remote work and are being flexible with partial remote.
I did a regular expression search in each job post text to see if a job offers remote work or not. The chart below shows the number of job posts that offer remote work. Total number of job posts in each month is usually around 800-1000, so if you are looking for % a good 12% on average allow remote work.

Visa
Silicon Valley and most of the technology companies in the USA rely heavily on foreign workers. With the arbitrary suspension of premium process for H1-B applications, most employees can't easily move and companies can not hire at the same speed.
I did a regular expression search for the term Visa and the below chart shows the number of job postings that sponsors visa. As you the jobs which sponsor visa is less than 5%.

Roles
While there are more engineering positions than anything else, I did a count of all roles including the level in software engineers and below is the chart that represents number of job posts over the last year.
    "Engineering Manager": 271,
    "Principal Software Engineer": 25,
    "Product Designer": 243,
    "Product Manager": 425,
    "Program Manager": 35,
    "QA": 353,
    "Senior Software Engineer": 818,
    "Software Engineer": 2975,
    "Staff Software Engineer": 10

Skills
I was really curious to see the popular skills over the last year. I generated the count by using a pre-defined dictionary of skills and below are the counts and a chart that represents the top skills asked for in 2018.
Edit: After posting to HN, I realized some of the skills has false positives during regex search, so until they are updated, please consider these as direction in general, but not as the accurate count. Apologize for the inconsistent data.
Edit 2: The regex false positive issue is resolved. Fixed it by using word boundaries on regex \\b<word>\\b.
html, 277
python, 273
.net, 216
react, 211
php, 124
docker, 92
android, 89
c, 80
golang, 79
postgres, 69
ios, 67
javascript , 64
git, 61
ruby, 54
django, 53
kubernetes, 51
angular, 49
rails, 48
java, 40
linux, 39
typescript, 31
rust, 29
shell, 26
swift, 23
scala, 22
react.js, 21
css, 21
julia, 20
vue.js, 20
excel, 16
kotlin, 13
elixir, 13
graphql, 13
spring, 11
sql, 11
reactjs, 10
erlang, 9
perl, 7
lua, 6
mysql, 6
haskell, 5
apache, 4
vuejs, 4
objective-c, 2

Perks
Just curiously I checked for number of job posts which offered free lunch over the last year and below is the chart representing it.

Hope this helped in giving you some insight into the job posts on Hacker News. I will open source the code used to analyze all this after cleaning up by this weekend, currently it's a combination of Golang, Python, Amcharts, Highcharts to analyze and visualize the hiring data. Follow me on Github to get notified when the repo is up or check back this post over the weekend for the repo link.
Update : Added a very initial version of the code here to help people understand the process/logic i followed for the blog post. Running the code doesn't automatically generates the charts, but hoping to get the repo into that stage in sometime, so it could be reused for other kinds of analytics projects.