
Everyone around me was trading meme stocks and most of them seem to be making reasonable profits. My obvious reaction was how do you guys come across these meme stocks before they take off? Most mention Reddit and the sub-reddit r/wallstreetbets in specific.
So when the GameStop frenzy was at the peak, I decided to build a leaderboard of the top stocks discussed on Reddit's Wallstreetbets forum. The goal was to understand the most discussed stocks on WSB and discover some new stocks.
Reddit Data & Parsing
First thing you would need to build a leaderboard is the comment data from the sub-reddit and fortunately Reddit has some of the best API's among most social websites. I was able to start streaming reddit comments from a subreddit on a web-socket channel in less than a hour.
Now I have the data, but what do I look for and how? I was able to source list of all equities ticker symbols from the NASDAQ website and to my surprise there's only like 7K public companies on NYSE and NASDAQ, two of the largest exchanges in United States of America.
At this point, I have the comments data, a list of symbols to match them against. One obvious way to do is to dump all the comments into some kind of storage and do a word count using some big data tools. This would have probably worked, but it's been a while I did any Hadoop/Spark style work. So I went with a more simple and straight forward approach, that is to build a Trie with all the equities tickers and compare the comments strings against the Trie. I got up and running with a working word checks in less than 2 hours.
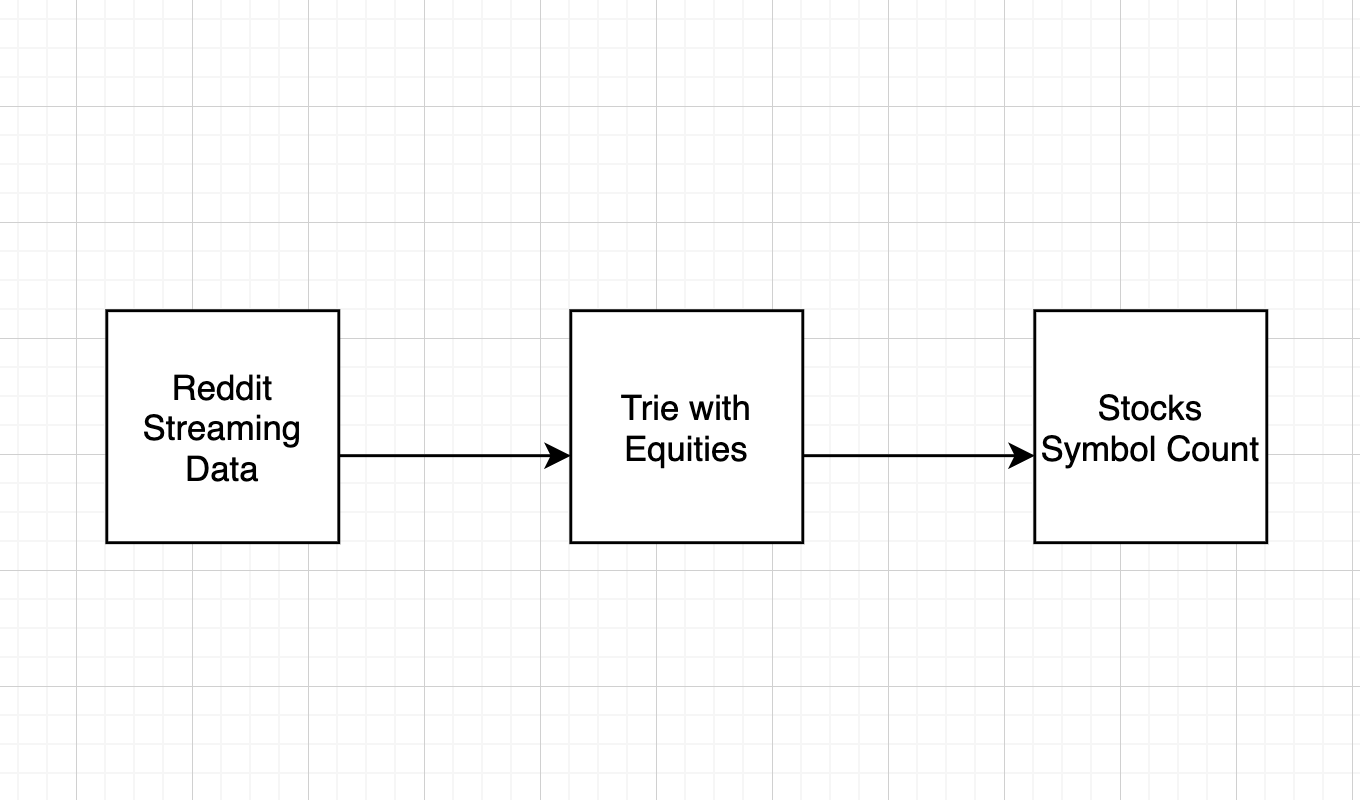
I saved the word counts by date in a postgres database. Now all we need is a web page that displays the leaderboard.
At work I use Django, so the easiest way to get started was to create a Django app and pull the stock counts in a view and in less than a hour Stonks News is up.
I had to find some bootstrap templates, remove the boilerplate I don't need and clean up the view, but at this point things were fairly straight forward.
Hacker News and The Economist features
Every year, promptly I work on a side project and post it on HackerNews, in the hopes that my post goes on to the front page. Fortunately it did 2 out of 3 times including this project, Stonks News.
Being on the first page of HN means you certainly will get like 20K to 50K page views, and I was super elated looking at the google analytics numbers in real time. One thing, I wasn't prepared for was to convert these visitors into email subscribers, because at that point my website was barely working and didn't even had a contact us page.
The next day, I added a link to newsletter sign up and a contact us link that kind of hyperlinks to sending me an email. The following day, I see an email from The Economist in my inbox and the email mentioned about how they found my website from the hacker news etc. They wanted to do a full article based on my reddit comment analysis and I happily obliged. You can find the article here.
SPACs Leaderboard
I was definitely overwhelmed with the response from Hacker News. At least 50 people reached out about how useful the website/leaderboard was and some of them had requested for new features.
One of the most requested features was a leaderboard for most traded SPAC stocks. Building this one was tricky, because there's no single data source for a stock like this.
I relied on around ten sources, had to aggregate them and clean up the data a lot. This whole process took more than 15 hours and was very frustrating, but in the end I had a list of fairy high confident SPAC stock data. I integrated this with my data pipelines that fetch stocks prices and volume every 30 seconds.
IPO Calendar
At this point, I got into the habit of quickly building simple data dashboards that provide useful information. One thing I could not find easily earlier was a way to know which companies are going public in the coming month. There are only a few sources that can provide this type of information and so I wanted to build one.
I started off by again aggregating data from around 6 sources, cleaned up this data and build a datasource out of it. All I had to do after was hook up a table component on the front end and I have a IPO Calendar table up and running.
Even though none of this is innovative or ground breaking, I kind of like the fact that I have access to this kind of data now since this makes it easy to build custom alerts for myself or potentially for others.
What's Next on Stonks News?
I am still figuring out where would stonks news exactly fit in, but I see it as a way to provide useful data analytics to millions of users who trade equities every month. Alerts and Charts are two areas I might focus in the next couple months. Most brokerages doesn't provide nuanced alerts and some websites which provide these are not free, obviously. I think there's appetite for a cheaper but reliable alerts service in the stocks niche and I might probably build it next.
Charts are great, but most broker websites provide candle charts and other information already, but if we can provide a better kind of visualization especially for new or inexperienced investors, I think there's a chance for reasonable success in this area.
Lastly, I think there's also a need for auto generating options suggestions based on upcoming earnings. This is something that most people do as a strategy, so automating this based on the upcoming company earnings calendar would be very useful.
Is there a service you think I should build, let me know by reaching out to me directly anytime.